Guidelines for performing the experiment
- Working with the dashboard
- Strategy for tuning the P-, I-, D- parameters of the controller. Ranges
- Processing results. Reporting
The dashboard
Follow the link to open Laboratory Site.
Watch the screencast video how to operate the dash-board
The login and password will be given to you by your teacher.
Find the ‘Dashboards’ menu and choose ‘MAIN VIEW’:
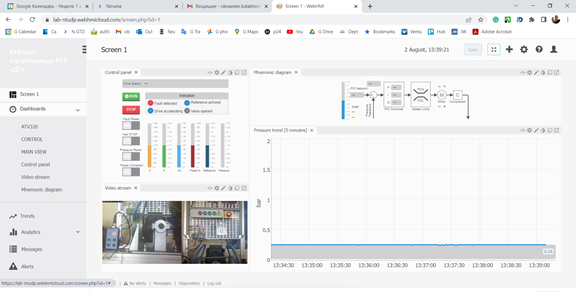
The ‘Control panel’
This window displays the current drive status.
Below you will find the push-buttons:
- RUN – launches the compressor drive
- STOP – ‘normal’ stop
And tumblers:
- Fault Reset – use it when the drive status is any fault
- Halt STOP – emergency stop (normally, you don’t need it)
- Pressure reset – opens the output valve to release the pressure quickly
- Power Contactor – use it to plug on and off the power supply.
The ‘Video stream’
This window shows two videos:
- The left window displays the compressor’s crank-shaft and indicates actual pressure
- The right window shows the indication of faults
- from left to right: fault detected (red lamp)
- Reference achieved
- Drive is accelerating
- Valve is opened
Note that there is a 1-2 sec lag of the video.
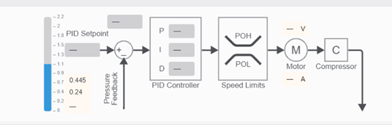
The ‘Mnemonic diagram’
This window has the input boxes where you should enter the reference and controller’s parameters
-
PID Setpoint: pressure reference, put the value up to 1.25
-
P: proportional gain, put the value in the range of 0.25 – 8
-
I: integral gain, put the value in the range of 0.25 – 10
-
D: derivative gain, put the value in the range of 0.25 – 10
The pressure trend shows the curve of the actual pressure together with the reference level.
NOTE: the ‘Screen 1’ tab provides smoothed curve of pressure in the different scale. Control buttons are active, too, but not the input boxes.
Strategy for tuning the P-, I-, D- parameters of the controller
Your goal is to tune the system for the ideal response.
-
Prepare the table for noting the effect of each of P-, I- and D component. Prepare the columns for the transients’ quality performances form the previous section and notes;
-
Vary parameters consequently, i.e. don’t change two or three parameters simultaneously. Only one at a time;
-
Wait for the pressure to drop to zero before re-activating the drive;
-
Set the P-gain to 1, others (I and D) to zero. Vary the P-gain alone and note its effect onto the parameters of transients. Choose the optimal P-value somewhere in the middle of the range 0.25-8;
-
Add I-component: set it to 0.25. Gradually increase the I component and note the difference;
-
Seek for the optimal combination of P- and I- components;
-
Add D-component. Seek for its best value.
Processing results
Your report should contain the following:
- A table with quantitative values of transients’ (overshot, static error etc.) and indications like ‘increasing’/’decreasing’, notes;
- Best combination of P-, I- and D- gains you recommend;
- Screenshot of the best transient you have managed to obtain;
- If you manage to produce – show several consequent oscillograms illustrating the influence of certain parameter,
- Conclusions about the process of tuning, noting the behavior of the system.
WARNING! Real operation of this test stand is different from what it is in theory! Investigate the real behavior of the control plant, do not trust the theory blindly!
