
Laboratory Work Interface
Access to the web interface for remote control of the laboratory work is performed using most modern web browsers (Chrome, Opera, Firefox, etc.).
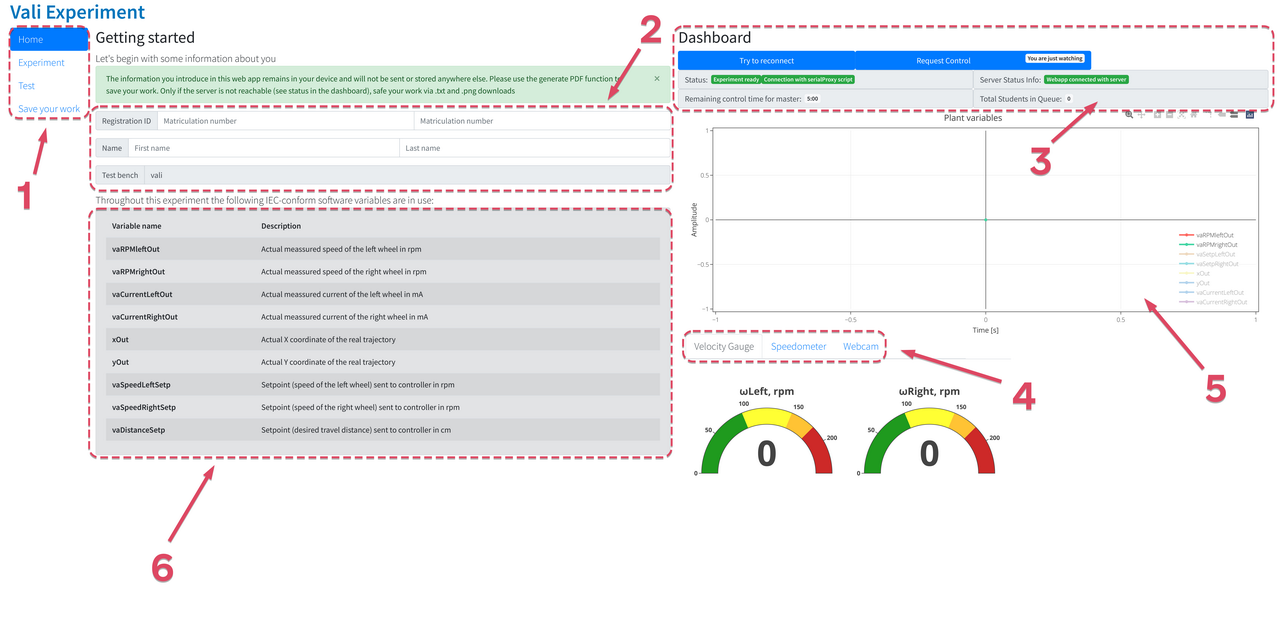
"Home" tab
To complete the laboratory work, first, you should go to the web interface link "Car Vali." Using the "Request Control" button on the "Dashboard" panel (Fig. 7, item 3), enter the three-digit access code provided by the instructor. After successful connection, enter your personal data in the "Getting started" field (Fig. 7, item 2). The entered data is only used to generate an automatic report and is not stored on the server or in any other form. To successfully generate a report, ensure that all ad-blocking tools are disabled (Adblock, uBlock, built-in browser tools, etc.). After filling in the data, you can proceed to the "Experiment" tab using the panel (Fig. 7, item 1).
Also, on the "Home" tab, you can find the following tools:
- Windows for viewing graphs "Plant variables" (Fig. 7, item 5);
- List of variables displayed on the graph (Fig. 7, item 6);
- Auxiliary graphical elements switch (Fig. 7, item 4): windows for viewing real-time video from an IP camera and graphical indicators of speed (rpm and km/h).
Experiment tab:
The "Experiment" tab is used to control the Car Vali testbed. The main goal of the laboratory work is to drive through the rotunda, fitting into the width of the Allowed zone of the road (Fig. 8, item 5). using the controls that are presented in the form of sliders in the "Set setpoint" field (Fig. 8, item 1).
Purpose of the sliders:
- vaSpeedLeftSetp [-210 210] – sets the speed of the left wheels within [-210...210] rpm.
- vaSpeedRightSetp [-210 210] – sets the speed of the left wheels in the range [-210...210] rpm.
- vaDistanceSetp [0 100] – sets the distance of movement of the robot car within [0...100] cm.
Using these sliders, you should set the path segments (chords) along the rotunda, which will describe the trajectory of the Car Vali within the permissible zone from the "Start position" to the "Finish" line (Fig. 8, item 5). Each segment is added using the "Add setpoint to queue" button in the "Set setpoint" field (maximum 15 segments). All entered chords will be displayed in the "Setpoints List" field (Fig. 8, item 2), as well as on the interactive graphic element with the image of the rotunda "Track for the experiment" (Fig. 8, item 5) in blue (Math). In the "Real/Mathematical Data" field (Fig. 8, item 6), the "Setpoint data" columns automatically calculate the coordinates of the "Car Vali" position in the x_world, y_world coordinate system. If you need to delete the entered points, the interface provides the "Remove" button in the "Setpoints List" field.
After setting the required number of points to reach the "Finish" line, you should send them as a task to the "Car Vali" object under study. To start the experiment, click the on/off switch in the "Run Experiment" field (Fig. 8, item 4). The progress of the experiment should be monitored using the graph by selecting the desired parameters using the field (Fig. 8, item 3), as well as video from the IP camera in real time.
At the end of the experiment, you should determine the coordinates of the real object "Car Vali" (x_world,y_world) using the indicators from the graphs. After that, transfer them to the response columns of the table "Real/Mathematical Data" (Fig. 8, item 6) of the columns "Real object`s data". The shape of the resulting motion trajectory can be monitored using the "Track for the experiment" - a yellow curve (Real).
After the experiment is successfully performed, go to the "Test" tab.

"Test" tab:
To successfully complete the laboratory work, you should answer all theoretical questions presented in the "Test your knowledge" field (Fig. 9, item 1).
All answers will be added to the automatically generated report. To save the report, go to the "Save your work" tab.

"Save your work" tab:
To generate the report, click on the "Generate my report as PDF!" button (Fig. 10, item 3). The final report records the date, time, and user access code (Fig. 10, item 1).
Be sure to pay attention to the warning (Fig. 10, item 2) regarding the need to disable all software tools that are designed to automatically block ads. In case of failure of the report generation system, the system provides protection in the form of the ability to download all the entered data in .txt format, as well as a screenshot of the field (Fig. 8, item 5)
After generating the report, you should send it to your teacher to get a good grade!
